

A jump test is one of the few assessments a performance staff can run across a full roster, repeat every week, and still learn something from. It takes seconds per athlete, needs little floor space, and reflects how the lower body produces and absorbs force. The hard part is not running the test. It is choosing the right one, measuring it the same way every session, and knowing which changes in the numbers deserve a response.
What Jump Testing Actually Measures
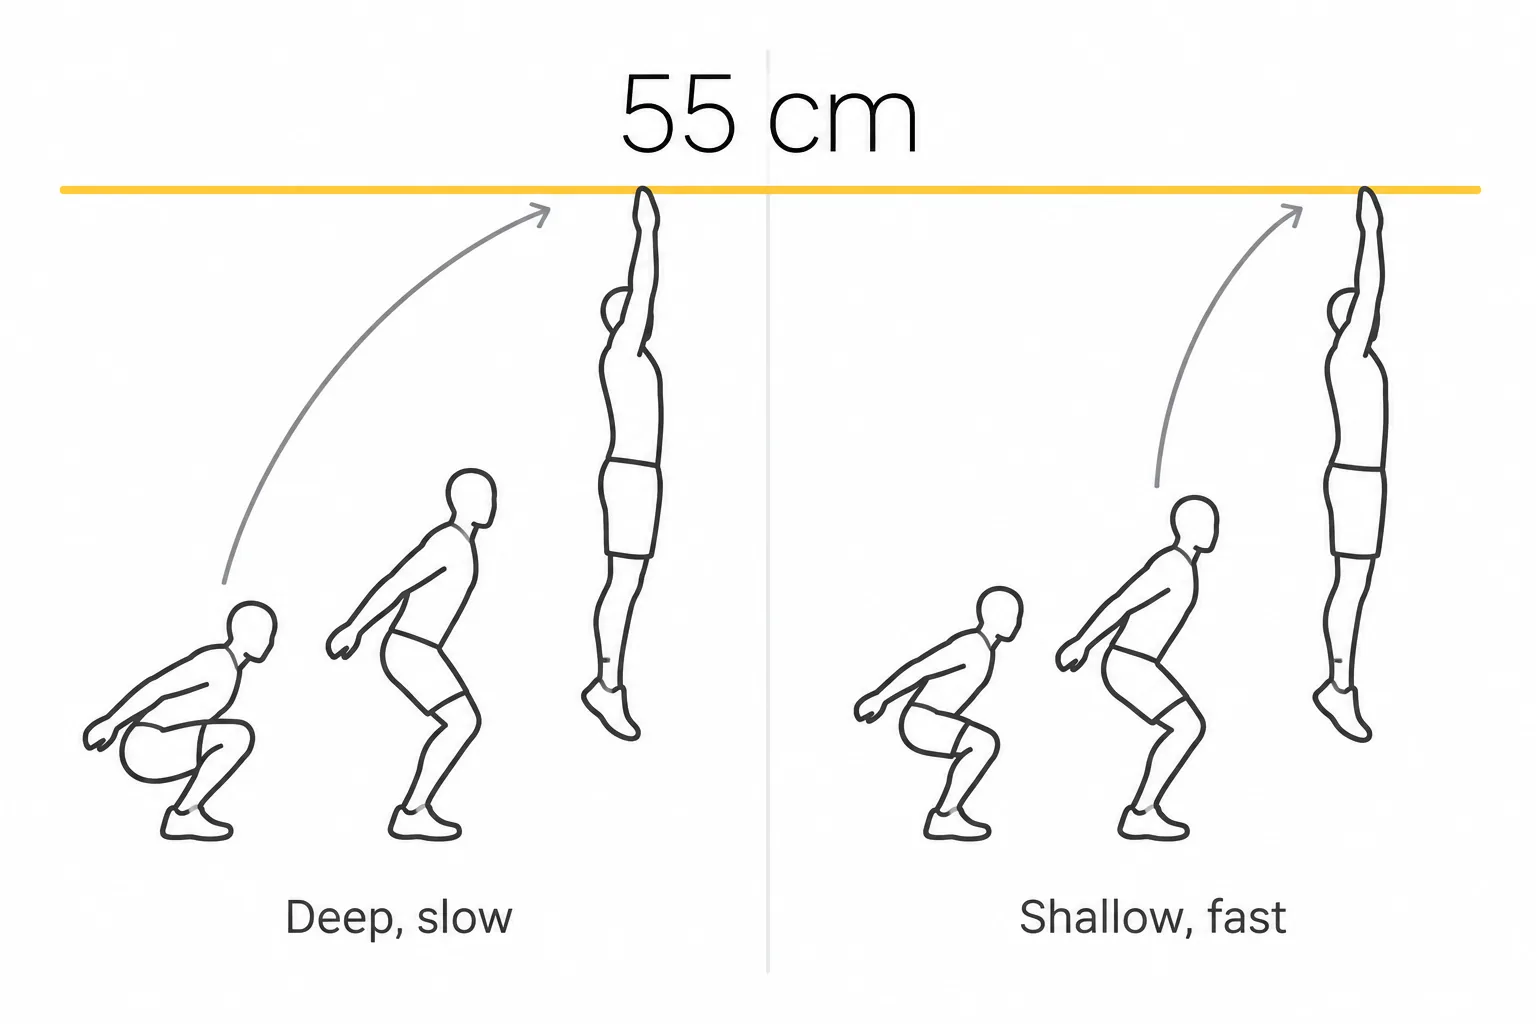
Jump tests capture three things: lower-body explosive power, neuromuscular readiness on the day, and how well an athlete uses the stretch-shortening cycle, the elastic energy stored and released when a muscle is loaded quickly and then shortens.
Jump height on its own is a shallow output. Two athletes can both reach 55 cm, one by dipping deep and slow, the other by loading fast and shallow. Same number, different qualities, different training response. The same applies to one athlete across a season: height can hold steady while time to takeoff creeps up, and a single number hides that completely.
That matters because the people reading the report want different things. A strength and conditioning coach wants a usable number before the session ends. A sport scientist wants measurements consistent enough to trend over months. An athletic trainer wants an objective baseline that stands up in a return-to-play discussion.
A test that serves all three has to be fast, repeatable no matter who runs it, and able to record how the jump was produced rather than only how high it went. That is the testing problem OnTraq was built around.
One boundary worth stating: jump testing describes performance and flags change. It does not diagnose anything, and it does not replace coaching or clinical judgment.
The Core Jump Tests
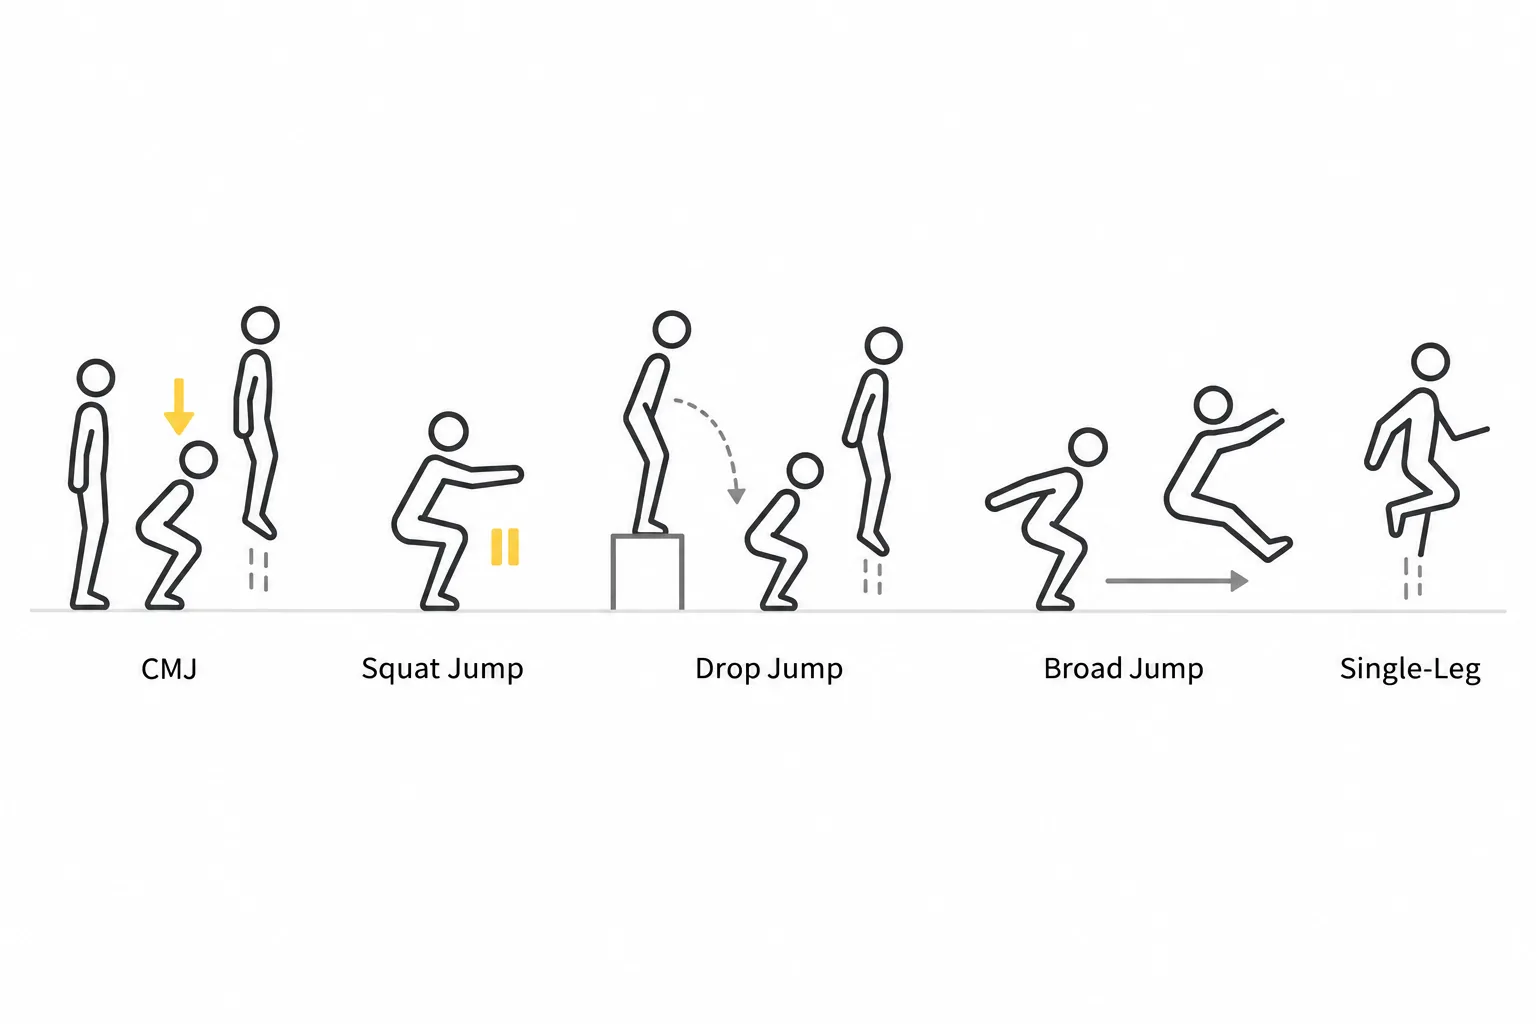
Each test isolates a different quality. Running all of them on every athlete is rarely necessary, and running the wrong one tells you very little.
Countermovement Jump (CMJ)
The athlete stands tall, dips rapidly into a partial squat, and jumps for maximum height. It measures general explosive power, including the elastic contribution of the fast dip.
The CMJ is the default team-wide test because the learning curve is close to zero. Standard protocol: three trials, 30 to 60 seconds of rest between them, report the best or the average, but pick one and stay with it.
Decide whether arm swing is allowed and keep that decision fixed. Hands on hips removes the arm contribution and reduces variation between trials; a free arm swing looks more like sport but adds noise. Neither is wrong. Switching between them mid-season is.
Squat Jump (SJ)
The athlete holds a static squat, roughly 90 degrees at the knee, pauses for two to three seconds with no downward movement, then jumps on command. Removing the dip removes the elastic contribution, so what remains is concentric force production.
This is the hardest test to standardize. Any small countermovement before takeoff voids the trial, and athletes do it without realizing it. Watch closely, or discard trials that show a dip in the force trace.
The payoff is the comparison. Dividing CMJ performance by SJ performance produces the eccentric utilization ratio, the ratio between countermovement jump and squat jump performance. A low ratio suggests an athlete is not converting a fast eccentric load into propulsion as well as they could.
Drop Jump and Reactive Strength Index (RSI)
The athlete steps off a box, commonly 20 to 40 cm, and rebounds as fast and as high as possible. The instruction matters: minimum ground contact, maximum height.
RSI is the output, calculated as jump height divided by ground contact time. It describes lower-leg stiffness and reactivity, which is why it travels well to court and field sports built on repeated short contacts.
Set box height per athlete, not per squad. Higher is not better. If contact time balloons when you add 20 cm, that athlete has passed the height they can handle reactively, and the number stops describing the quality you wanted.
Standing Broad Jump
A two-foot jump forward for maximum distance, measured from the toe line to the nearest heel contact. It tests horizontal force production, needs a tape measure and a flat surface, and works in facilities with no plates, mats or camera coverage.
It earns its place next to the vertical tests because sprint acceleration is driven horizontally. An athlete can look strong vertically and still be poor at projecting force forward.
Single-Leg and Asymmetry Testing
Most jump testing guides stop at bilateral tests, which is exactly where the useful information starts for clinical staff. Single-leg CMJ, single-leg hop for distance and triple hop for distance all produce a left-right comparison, usually expressed as a percentage difference between limbs.
Bilateral tests can hide a limb quietly offloading itself, because the other leg compensates inside the same movement. Research on single-leg drop jumps describes the approach as useful for identifying between-limb asymmetries and functional deficits that bilateral tests may overlook. For athletic trainers and physical therapists building return-to-play criteria, that is the whole point.
Legacy Tests: Sargent Jump and Vertec
The Sargent test, chalk on the fingertips and a mark on the wall against a standing reach, is the original field method. The touch-vane device is its mechanical descendant: the athlete swats the highest vane they can reach.
Both measure reach displacement rather than center of mass displacement, so their numbers sit above what timing-based systems report. Compared against a phone-based flight-time app, the vane device produced significantly higher jump height and peak power values.
These tests remain useful for combine-style screening and athlete engagement, since the result is visible instantly. They are weak for detecting the small changes that matter across a season.
| Test | What It Isolates | Best For |
|---|---|---|
| Countermovement Jump (CMJ) | General explosive power, including the dip’s elastic contribution | Default team-wide test, near-zero learning curve |
| Squat Jump (SJ) | Pure concentric force production, no elastic contribution | Paired with CMJ to get the eccentric utilization ratio |
| Drop Jump / RSI | Lower-leg stiffness and reactivity | Court and field sports built on repeated short ground contacts |
| Standing Broad Jump | Horizontal force production | Catching athletes who are strong vertically but weak at projecting force forward |
| Single-Leg / Asymmetry Testing | Left-right differences bilateral tests can hide | Athletic trainers and physical therapists building return-to-play criteria |
| Legacy Tests (Sargent / Vertec) | Reach displacement, not center-of-mass displacement | Combine-style screening and athlete engagement, instant visible results |
Equipment: What Each Method Measures and What It Misses
| Method | What It Measures | What It Misses | Cost Tier |
|---|---|---|---|
| Force plates | Full force-time curve, peak power, rate of force development, braking separated from propulsion | Fixed to one location | Highest, the significant outlay |
| Jump mats / optical timing | Height from flight time | Landing technique skews it, a knee tuck extends flight time and inflates the result | Low end of capital equipment |
| Touch vanes / chalk | Reach displacement | Coarse; depends on the operator’s read of the mark | Lowest, next to nothing |
| Phone app video analysis | Flight-time estimates | Limited by camera frame rate and a single plane of view | Low, affordable |
| Camera-based movement analysis | Joint angles and positions through the whole movement, how the jump was produced, not just the outcome | No direct force data on its own | High, often sold as a subscription |
The numbers are not interchangeable across categories. A systematic review of jump height calculation methods found that flight time and impulse-momentum methods produce significantly lower height values than other approaches, because both measure only from the center of mass at takeoff to the apex.
Practical rule: never compare an athlete’s mat number to last year’s vane number and call it progress.
On cost, think in categories rather than figures, since configurations and regions move prices constantly. Chalk and a wall cost almost nothing. Vanes and mats sit at the low end of capital equipment. Force plate arrays and camera systems are the significant outlay, which is why some are sold as subscriptions rather than purchases. OnTraq sits in that last group.
Reading the Metrics: From Jump Height to Decisions
Outcome metrics are jump height, flight time, contact time, RSI and distance. Strategy metrics are countermovement depth, time to takeoff, braking duration, landing mechanics and left-right difference. For one-off screening, outcome metrics are enough. For repeat testing, strategy metrics carry the signal, because a fatigued athlete often protects the outcome by changing the strategy.
Build a baseline before you interpret anything. Population norm tables are a weak comparison for an individual professional athlete. That athlete’s own recorded baseline is a strong one.
Then learn your own noise floor. Reliability work on portable jump measurement devices reports the typical measurement variation for each device across trials and sessions, and that figure defines the smallest change you can separate from measurement error. Reacting to a 2 cm drop is only justified if your method’s variation sits well below 2 cm.
A good score depends on sport, position, sex, age, training age and test method, in roughly that order. The question worth asking is not whether an athlete jumps well for their sport. It is whether they jump like themselves this week.
Building a Jump Testing Protocol Your Team Will Actually Run
Standardize the controllable variables: same warm-up, same time of day relative to training, same verbal instruction, same equipment, same trial count, same rest intervals. Write it on one page and keep it where testing happens.
Baseline in pre-season, then run short check-ins regularly rather than one large annual battery. A CMJ and a single-leg CMJ take under two minutes per athlete and fit inside a warm-up or cool-down window, which is what keeps testing alive once the competitive calendar starts.
Check your constraints before committing to a protocol: ceiling height for vertical work, a clear run-in for horizontal jumps, and a realistic athletes-per-hour figure. Programs usually fail for four reasons. Testing takes too long. It disrupts training. Results shift depending on who ran the session. And the data lands in a folder nobody opens.
Timing matters at the organizational level too. Baseline windows open at the start of pre-season, so systems need to be installed and staff trained before that window, not during it. That puts the buying conversation in the off-season for professional clubs, and ahead of the fiscal reset for college programs.
How OnTraq Fits Into Jump Testing
OnTraq is an eight-camera system that captures how an athlete moves with no markers and no wearables. Testing takes about 90 seconds per athlete, so a squad of 20 moves through in roughly 30 minutes. It builds a skeleton model scaled to each athlete’s body, detects the movements automatically as they happen, and returns a report and trend dashboard within minutes.
Related readingMarkerless Motion Capture: The Complete GuideRead the guide →Every session is compared against that athlete’s own baseline. A drop in jump height, a change in countermovement depth, or one leg starting to take less load shows up as a deviation rather than as a number somebody has to interpret from scratch. Any staff member can run it, which removes the operator-to-operator inconsistency that undermines longitudinal data. It also synchronizes with force plates when a team wants force output alongside movement data, so both sit in one report instead of across two systems.
The markerless motion capture approach here is built on Qualisys’ proven foundation of biomechanical accuracy, four decades of movement science applied to a workflow that fits inside a training session.
One note for teams planning ahead: early adopters receive Silver tier features, including the full and sport-specific movement library, API integration, force integration and the personalized trend dashboard, at the Bronze price. That framework runs until at least January 2027.