

The countermovement jump test is the most common lower-body power assessment in team sport, and one of the most commonly misread. Two athletes can produce the same jump height with entirely different movement strategies. A score can fall two centimeters and mean nothing, or hold steady while the way it was produced shifts week after week.
This guide covers the protocol, the equipment options, the metrics worth tracking, and how to turn repeated CMJ and vertical jump testing into decisions performance staff can defend.
What the Countermovement Jump Test Measures
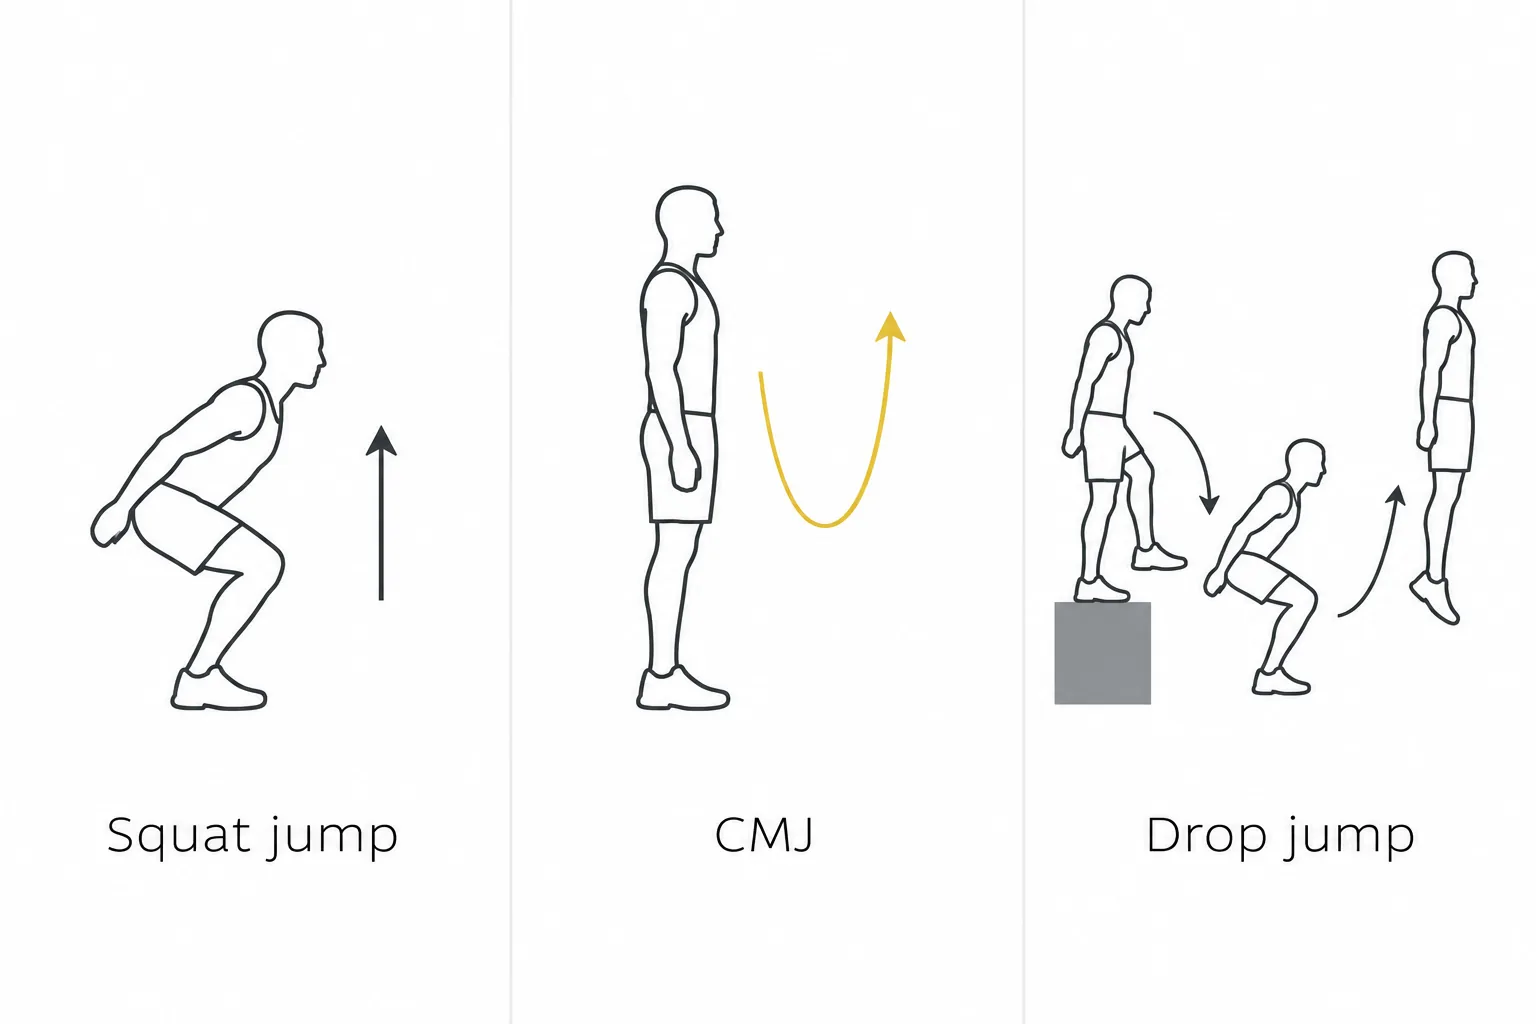
A countermovement jump is a vertical jump preceded by a fast downward dip. The athlete stands tall, drops quickly into a partial squat, then reverses without pausing and drives upward as high as possible. That reversal is the point of the test.
Muscles and tendons are stretched under load during the downward phase and return energy during the upward phase, so the CMJ reflects how well an athlete uses the stretch-shortening cycle, not only how much force the legs can generate.
Staff use it as a marker of lower-body explosive output and neuromuscular readiness. It also responds to accumulated load: heavy training weeks, congested fixtures, and long-haul travel tend to show up either in jump output or in the movement strategy behind it. It is a monitoring tool, not a diagnostic one. It tells you something changed. It does not tell you why.
The test became the default in field and court sport for practical reasons. Skill demand is low, so scores stop being confounded by technique learning after a familiarization session or two. Fatigue cost is minimal, so it can run before training rather than instead of it. It takes seconds per athlete. And it repeats well, provided the protocol holds.
Two relatives are worth separating clearly. The squat jump begins from a held static squat with no dip, isolating concentric force production; comparing it against the CMJ shows how much an athlete actually gains from the countermovement.
The drop jump test begins from a box, so the athlete lands and rebounds, which loads reactive strength and short ground contact times. Different questions, different tests.
Who Should Use the CMJ Test
- Strength and conditioning staff tracking how a roster is responding to a training block, and checking readiness before a hard session.
- Sport scientists building longitudinal baseline records, where consistency across sessions and operators matters more than any single score.
- Athletic trainers and physical therapists who need objective measures to sit alongside their own assessment in return-to-play conversations and documentation.
- Field and court sport programs in general, where jumping, sprinting, decelerating, and cutting load the same tissues the CMJ interrogates.
One boundary is worth stating up front. The CMJ is not a standalone verdict on whether an athlete is healthy or ready. It is one input, and it is most useful read next to training load, subjective wellness, and the practitioner’s own eyes.
How to Perform a Countermovement Jump (Step-by-Step Protocol)
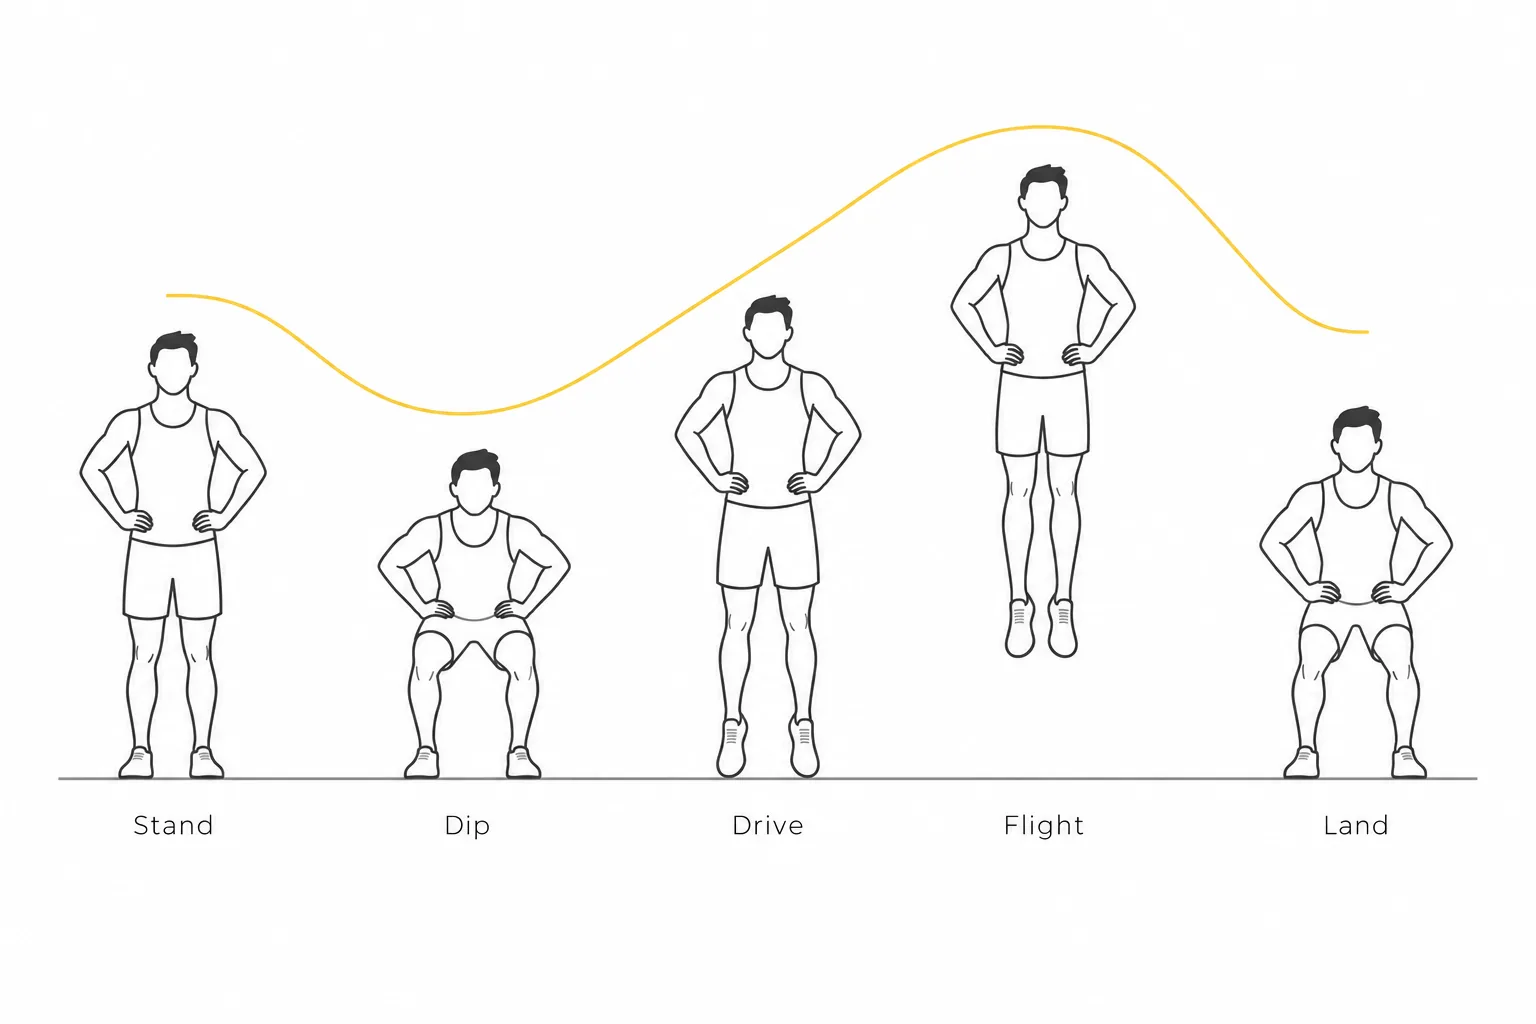
The countermovement jump test protocol is short. The discipline is in repeating it identically.
- Standardize the warm-up. Same duration, same exercises, same order, same intensity. A warm-up that varies between sessions moves jump height on its own and contaminates every trend you try to read afterwards.
- Set the start position. Athlete stands upright on the measurement surface, feet roughly shoulder-width, weight settled and still. Hands on hips for the standard version. Allow a moment of quiet standing so the device can register body weight cleanly if you are using a force plate.
- Execute the downward phase. A fast dip to a self-selected depth. Do not coach a specific depth for a monitoring test; the athlete’s chosen depth is part of what you are measuring. No pause at the bottom.
- Reverse immediately. Drive through the floor into full extension of hip, knee, and ankle. Instruct for height, not for form. “Jump as high as you can, as fast as you can” produces the intent you want.
- Do not tuck in the air. Legs stay long. Tucking the knees inflates flight-time-based results without the athlete going any higher.
- Land under control. Two feet, roughly the same spot, soft hip and knee flexion, brief hold to show balance. Stepping forward or sideways invalidates the trial on most devices.
- Rest and repeat. Multiple trials per session, with passive rest between each so later attempts are not fatigued versions of the earlier ones. Three to five recorded trials after a familiarization attempt is common practice. Decide in advance whether you report the best trial or the mean, then never switch.
Record the context with the score: time of day, footwear, surface, device, and what the athlete did in the previous 24 to 48 hours. Without that, an unexplained dip six weeks later is unreadable.
Arms on Hips or Arm Swing? Choosing a Variant
Hands on hips removes the arm contribution and isolates the lower body. It produces lower jump heights and less variation between trials, which makes it the better choice for monitoring.
The arm-swing variant produces higher jumps, commonly cited as roughly 10–20% higher and sometimes substantially more depending on the athlete and technique, and looks more like what athletes do in competition, but the arm action itself becomes a source of session-to-session variation.
The rule matters more than the choice: pick one, use it consistently, and never mix the two inside the same tracking program. An athlete whose arms creep off their hips mid-season will produce a flattering trend line that means nothing.
Equipment Options for CMJ Testing
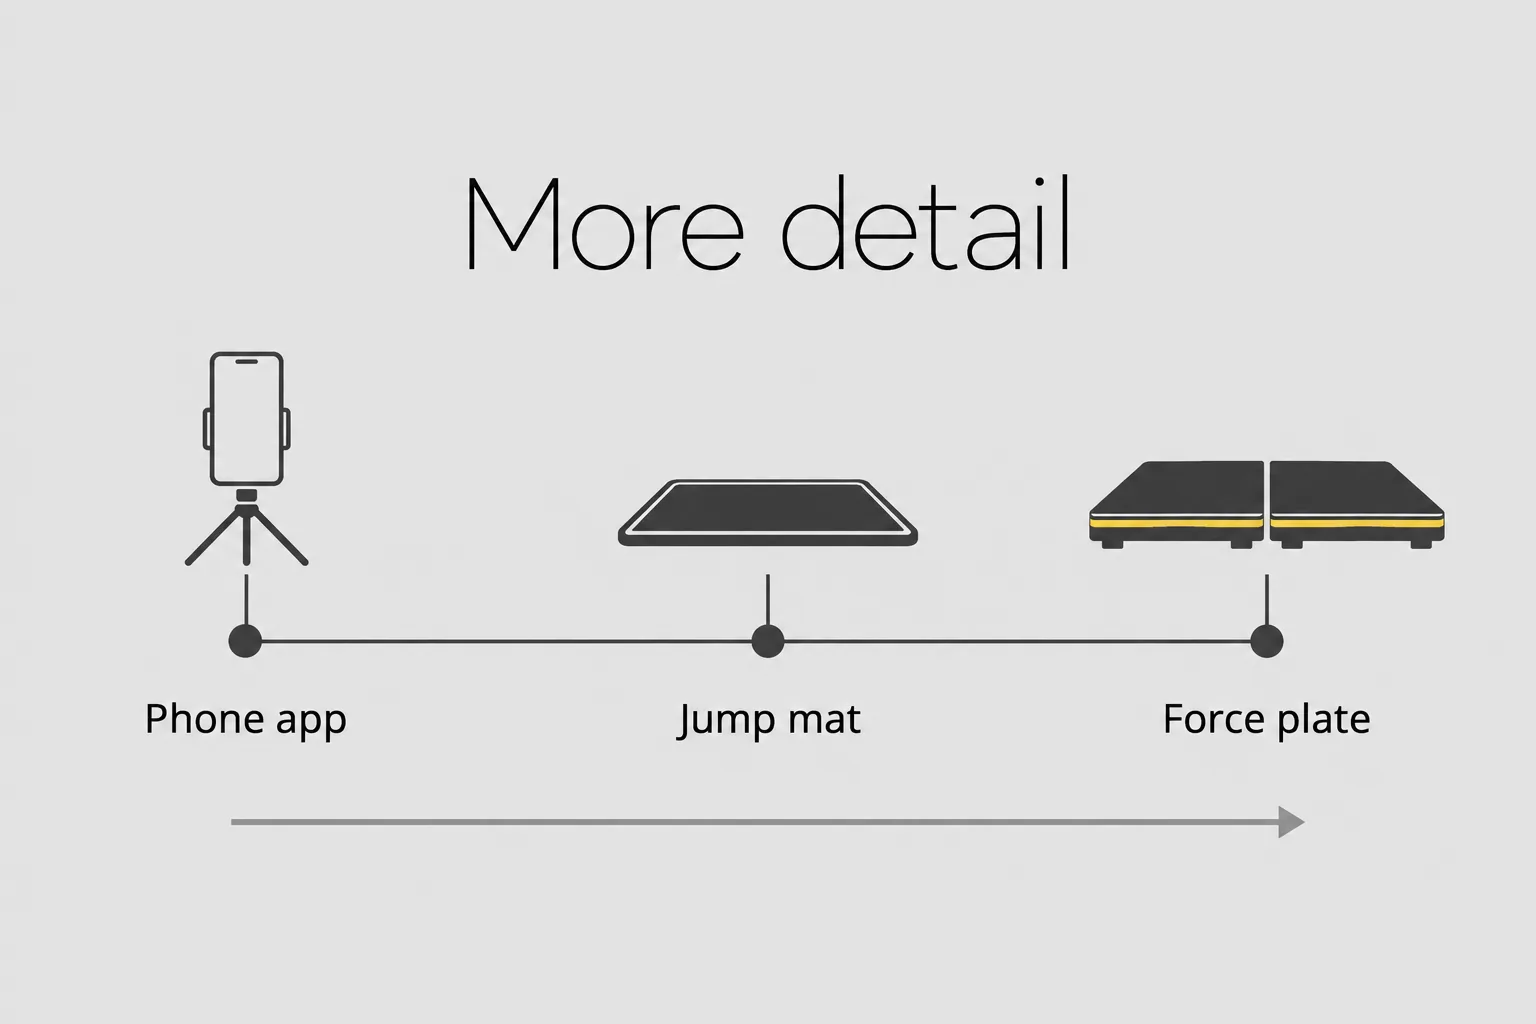
Countermovement jump test equipment sits on a spectrum from cheap and rough to detailed and demanding.
Force plates measure ground reaction force (GRF) over time. That single signal produces jump height by the impulse-momentum method, plus peak and mean force, power, phase durations, and left-right contribution. They are the reference option for CMJ testing and the most detailed, at the highest cost and with the most setup discipline required.
Contact mats and jump mats measure flight time and derive height from it. Portable, affordable, quick to deploy at a training ground. The limitation is that flight time is only as honest as the athlete’s technique, and you learn nothing about how the jump was produced.
Camera-based movement analysis systems, often searched for as markerless motion capture, capture what the body did during the jump: joint angles, positions, and loading pattern through the dip and the landing. A 3D motion capture system that needs no markers makes this practical at roster scale rather than lab scale.
Smartphone apps are the most accessible entry point and the most operator-dependent. Camera angle, frame rate, lighting, and who is holding the phone all move the number.
The critical point applies across all four: these methods are not interchangeable. Different devices and different calculation formulas produce different absolute values for the same jump. A mat score and a plate score are not comparable, and neither is a plate score from last season against an app score from this one. Choose a method, then stay with it.
The Metrics That Matter and How to Interpret Them
Jump height is the outcome. Every other metric explains the jump strategy behind that outcome, which is where the useful information lives.
According to Rob Gathercole, PhD, jump height is easy to measure, but it does not always change in response to fatigue or longer-term training adaptations. His work suggests that looking only at the final jump height can miss meaningful changes in how an athlete produces the movement.
Instead, CMJ analysis can be used to examine the entire movement and identify changes in force, velocity, timing, and movement strategy. This makes the test more useful as a monitoring tool because two athletes can maintain similar jump heights while producing those results through different neuromuscular strategies.
Jump Height
Two routes to the same number. Flight time measures how long the athlete is airborne and converts it to displacement, which assumes take-off and landing positions are identical. Impulse-momentum uses force plate data to calculate take-off velocity directly and is not affected by what the legs do in the air.
This is why flight-time methods reward bad technique. An athlete who tucks the knees or points the toes before landing extends time in the air without raising their center of mass, and the device reports a higher jump. Always record which method produced the number, and treat height from one method as a separate metric from height from the other.
Peak and Mean Power, Peak Force
Peak force describes how hard the athlete drives into the ground. Power combines force with the speed at which it is applied. Mean concentric power is usually more stable from session to session than peak values, which spike and dip on single trials, so it is often the better trend metric.
Normalize to body mass when comparing athletes to each other. A 110 kg lineman and a 65 kg winger will never be comparable on absolute power, and relative values put them on the same axis.
Eccentric Duration and Countermovement Depth
Eccentric duration is how long the downward loading phase takes. Depth is how far the athlete dips. Together they describe the strategy behind the jump.
This is where CMJ monitoring earns its place. An athlete who reaches the same height as last month but takes noticeably longer to get there, or dips considerably deeper to do it, has changed how they produce the result. Height alone hides that entirely. Depth also drifts across a season, so record it every time rather than assuming it holds.
Left-Right Asymmetry
Asymmetry compares each limb’s force contribution during take-off and during landing. It is most valuable in return-to-play conversations, where an objective number sits alongside the practitioner’s assessment rather than replacing it.
Both phases are worth tracking. Research has linked asymmetry in either the takeoff or the landing phase of the CMJ to elevated injury risk on its own, and which phase shows more asymmetry in a given athlete varies by population and jump type rather than following a fixed rule.
Two cautions apply. Asymmetry values are noisy trial to trial, so read them across several trials and several sessions. And a single asymmetry number is not a health verdict on anybody; it is a prompt to look closer.
In research on collegiate athletes, an inter-limb power asymmetry above 10% has been linked to roughly a 9 cm jump-height deficit, and many practitioners use a 15% asymmetry threshold as a flag for elevated injury likelihood.
Reactive Strength Index Modified (RSImod)
RSImod is jump height divided by time to take-off. It captures something height alone cannot: whether the athlete produces their output faster or slower than usual.
An athlete holding jump height while time to take-off lengthens is trending in a direction worth watching, and RSImod surfaces that in one number. Most coverage of CMJ testing stops at height and power. The movement-strategy metrics are where fatigue tends to appear first.
Countermovement Jump Normative Data and What Counts as a Good Score
This is the most requested and least useful part of jump testing. Published countermovement jump test normative data varies by sport, sex, age, playing level, and, critically, by measurement device and calculation method. A percentile table built on force plate impulse data does not describe your squad if you are testing on a jump mat.
So when an athlete asks what a good CMJ jump is, the honest answer has two parts. Broadly, trained team-sport athletes sit well above general population values within their own reference group, and athletes in jumping-dominant sports higher again.
But the specific number depends on how it was measured, and any table that does not state its device and protocol should be treated as background reading rather than a benchmark.
Use population norms for squad context and recruiting conversations. Use the athlete’s own history for training decisions. Percentiles do not tell you whether this Tuesday is a good day to load a specific player. Their baseline does.
From Raw Numbers to Decisions: Building a Baseline
According to researchers studying elite rowers, the reliability of individual CMJ variables can vary considerably, which matters when deciding whether a change represents a meaningful performance shift. In their study of 14 elite male rowers, seven of nine measured variables showed acceptable reliability, with coefficients of variation below 5%.
The researchers also found that many observed changes exceeded the threshold needed to distinguish meaningful changes from normal measurement variation. This highlights why performance staff should understand the reliability of the metrics they track before interpreting small changes as meaningful.
A countermovement jump test result is only interpretable against something. Building that something is a process, not a single session.
Establish the baseline over several sessions in a rested state. One test captures one day, including whatever that day contained. Three to five sessions across a settled period give you a central value and, more importantly, a sense of spread.
Learn the normal day-to-day variation before you react to anything. Every athlete has a range they bounce around inside for no meaningful reason. Until you know how wide that range is for a given player on a given device, you cannot separate a real drop from noise, and staff who chase noise lose credibility fast.
Read direction, not single points. Three consecutive sessions trending downward is a signal. One low Tuesday after a bad night’s sleep is not.
Tie changes to context. Training load, match minutes, travel, and fixture density explain most of what jump testing shows. The number is the prompt; the schedule is usually the answer.
The failure mode here is familiar to anyone who has run a monitoring program: the data gets collected, exported, and never looked at again.
Solving that is a workflow problem rather than a measurement problem. It needs the same protocol every session, results that arrive fast enough to act on, and a view that shows an athlete against their own baseline instead of against a spreadsheet of everyone else.
That personal-baseline comparison and trend view is the core of how OnTraq approaches athlete testing, because testing that never reaches a decision is just occupied training time.
Common CMJ Testing Mistakes
Most bad CMJ data comes from four places.
Athlete technique. Tucking the legs in flight, pausing at the bottom of the dip, changing dip depth between trials, letting the arms drift off the hips, and stepping forward on landing. All five change the number without changing the athlete.
Protocol drift. A different warm-up, a different time of day, a different surface, or testing after a heavy session one week and before one the next. Each is small on its own, and they compound.
Measurement changes. Switching devices or calculation methods mid-program resets your history whether you acknowledge it or not. So does a different operator each session on any method where the operator influences the result.
Analysis errors. Comparing an athlete to a published norm table instead of their own record. Reacting to one poor session. Reporting best trial some weeks and mean trial others.
One theme runs through all of them.
Inconsistent method is the single largest source of false signal in jump testing.
More precision in a device will not rescue a protocol that moves.
Fitting CMJ Testing Into a Real Training Week
The protocol is easy. Getting 25 athletes through it every week without losing training time is the actual constraint.
Position in the session. After the standardized warm-up, before any fatiguing work. Testing at the end of a session measures fatigue rather than readiness, which is a valid choice if you make it deliberately and repeat it.
Frequency. Weekly monitoring suits in-season readiness tracking. Block-based testing, at the start and end of a training phase, suits program evaluation. Return-to-play checkpoints follow the clinician’s timeline rather than the calendar. Many programs run all three.
Roster logistics. The realistic target is a whole squad inside a warm-up window, not a dedicated testing block that costs half a session. If team-wide testing takes hours, it stops happening in-season, which is exactly when the data would be most useful.
Where to start. Pre-season is the natural window. Staff have time, athletes are rested, and the baselines set then govern how everything is read for the rest of the year. Programs that miss that window generally spend the season comparing against numbers collected under inconsistent conditions.
Pairing Jump Testing With Movement Analysis
Force data answers how much and how fast. It does not answer how the body did it.
Two athletes can produce identical jump heights, identical peak power, and near-identical asymmetry values while moving very differently: one dipping with knees tracking well, hips loading evenly, and landing under control, the other collapsing inward through the knee and absorbing the landing on one side. On a force plate those two look similar. On camera they do not.
That is the case for pairing jump testing with movement analysis. A camera-based system captures hip, knee, and ankle positions through the dip, the drive, and the landing, so the strategy behind the number becomes visible rather than inferred.
OnTraq is built for this at roster scale. Eight cameras, no markers to place and no wearables to charge or sync, and roughly 90 seconds per athlete, which is how a squad of 20 moves through testing in about half an hour instead of most of a morning.
The system builds a model from the individual athlete’s own body dimensions, detects the movements automatically, and returns a report comparing the session against that athlete’s personal baseline.
Force plates can be synchronized so force and movement sit in the same record rather than in two systems that never meet.
The engineering behind it comes from Qualisys, who have worked in movement science since the 1980s, so the accuracy foundation is the same one their laboratory systems are built on. The design goal is accuracy and ease together rather than one traded against the other, because a testing program only produces trends if staff can run it every week.
Frequently asked questions
What is a good CMJ jump height?
How rare is a 30 inch vertical?
How do you calculate CMJ jump height?
How many CMJ trials should an athlete perform per session?
Is a countermovement jump test calculator accurate?
How often should teams run CMJ testing?
Can CMJ testing be done without force plates?
What is the difference between a countermovement jump and a drop jump?
If you are setting up a baseline testing program before pre-season, the OnTraq team can walk through facility requirements, camera placement, and how jump testing fits into your existing weekly structure.